Welcome to the thrilling world of trading, where the ability to read the market’s tea leaves can turn the tide in your favor. Whether you’re eyeing the stock market, diving into the depths of forex, or navigating the volatile waves of cryptocurrency, one thing remains constant: knowledge is power. And in the realm of trading, understanding chart patterns is akin to holding a treasure map. These patterns, hidden in plain sight among the peaks and valleys of market charts, are the Rosetta Stone for traders seeking to decode market sentiment and make informed decisions.
But why, you might ask, is this knowledge so crucial? Simply put, chart patterns are the footprints left behind by the collective actions of traders. They tell a story of supply and demand, of fear and greed, and of moments when the market is poised for a significant move. By mastering the art of chart pattern recognition, you’re not just learning to predict the market’s next move; you’re gaining insights into the psychological underpinnings of market behavior.
This guide, “Mastering the Market: A Beginner’s Guide to Chart Patterns and Trading Strategies,” is your first step on a journey to becoming fluent in the language of the markets. From the bullish optimism of an ascending triangle to the warning signs of a head and shoulders pattern, we’ll uncover the secrets that each pattern reveals. So, buckle up and prepare to embark on an adventure into the heart of trading strategy, where each chart pattern unlocks new potential for understanding and profit.

The Basics of Chart Patterns
Before we dive into the nitty-gritty of individual patterns, let’s establish a foundation. Chart patterns are the alphabets of the trading language, a visual representation of the battle between buyers and sellers in the financial markets. These patterns form over time and signal to traders whether it’s time to buy, sell, or just sit tight.
Definition and Importance
At its core, a chart pattern is a series of price movements that are graphically represented on a chart. Traders and analysts study these patterns to predict future price movements based on past behavior. Why? Because markets have memory. The patterns you see today have shown up time and again, proving their reliability and predictive power.
Types of Chart Patterns
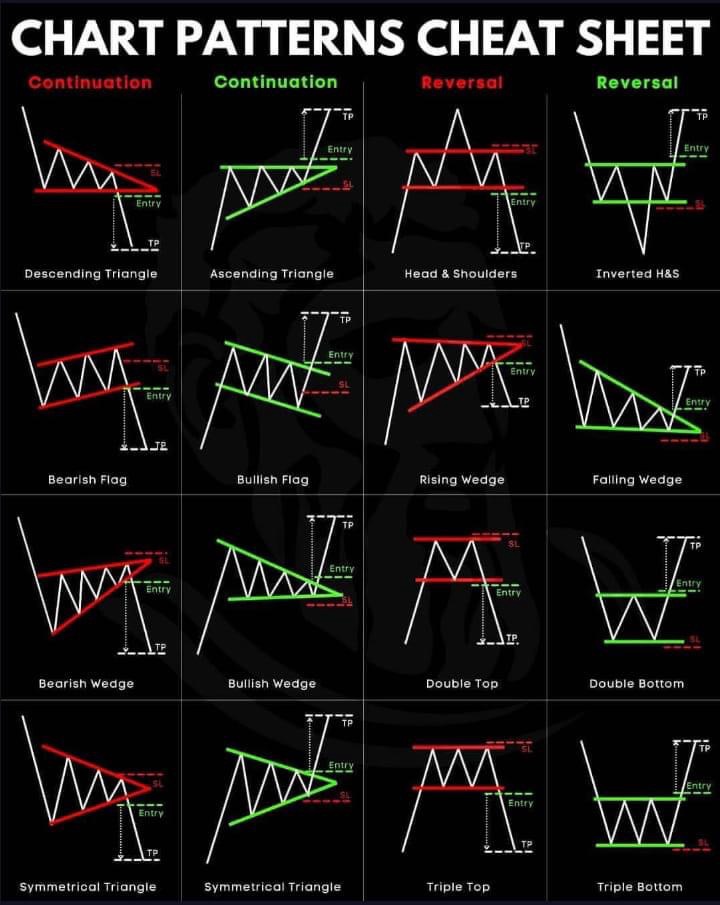
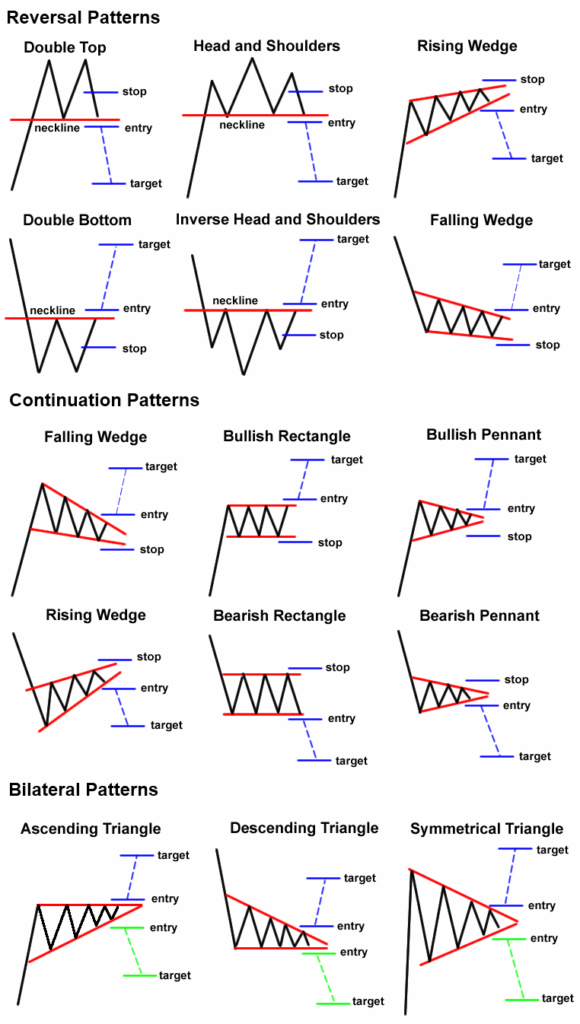
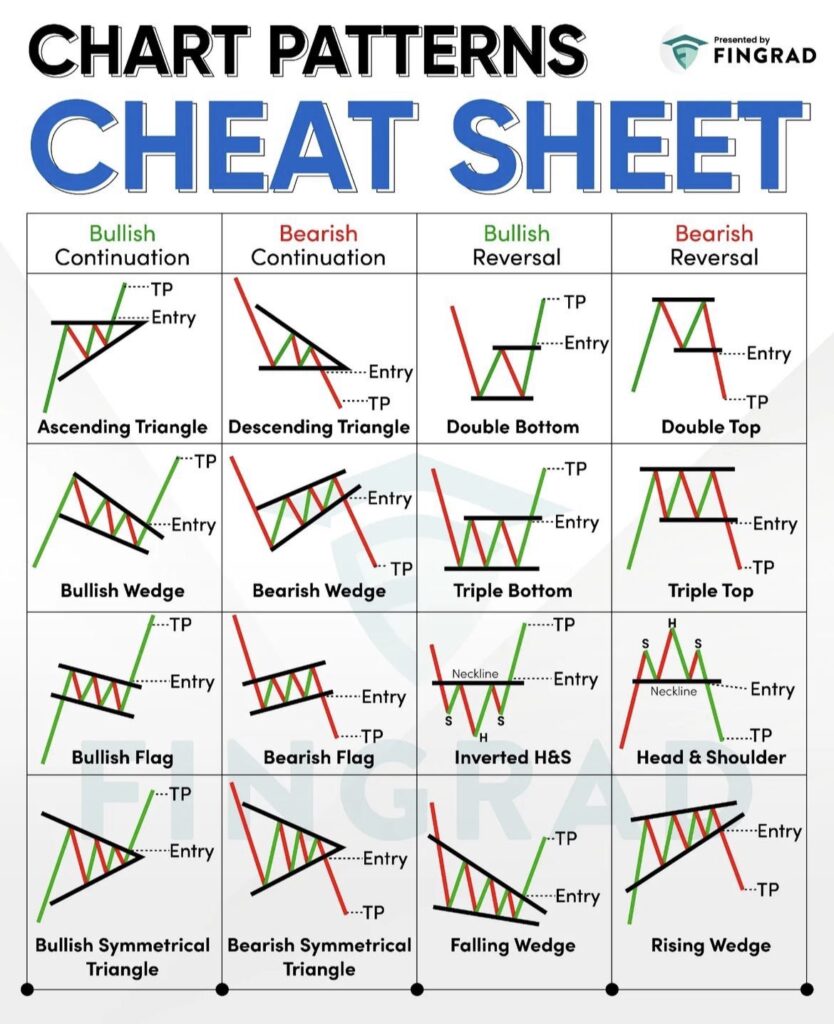
Chart patterns fall into two main categories: continuation and reversal.
- Continuation patterns suggest that the ongoing trend will persist. Imagine you’re reading a thrilling novel, and suddenly, there’s a brief interlude. You expect the main storyline to continue afterward, right? That’s the essence of continuation patterns in trading.
- Reversal patterns, on the other hand, indicate that the current trend is about to change direction. It’s like a plot twist in our novel analogy, where the story takes an unexpected turn.
Understanding these patterns is crucial for making informed trading decisions. They not only help in predicting market movements but also in identifying high-probability entry and exit points, setting profit targets (TP), and managing risk effectively.
As we progress, remember that while chart patterns are powerful tools, they’re not infallible. They work best when combined with other forms of analysis, such as fundamental analysis or technical indicators. This holistic approach to trading can significantly increase your chances of success in the markets.
In the following sections, we’ll explore some of the most common and powerful chart patterns, starting with continuation patterns. Get ready to unlock the secrets of the market’s language and take your trading strategy to the next level.

Continuation Patterns Explained
Diving deeper into the world of trading, let’s focus on continuation patterns. These patterns signal that, despite a brief pause or pullback, the prevailing trend is likely to resume. Recognizing these patterns can be incredibly valuable for traders looking to ride the momentum of an ongoing trend.
Bullish and Bearish Flags
Bullish flags are formations that occur after a significant upward price movement, followed by a consolidating downward trend, resembling a flag on a pole. The “flagpole” is formed by the initial price surge, while the “flag” is the small downward trend. A bullish flag signals that the price is likely to continue climbing after breaking out of the flag.
Conversely, bearish flags are the mirror image, forming after a sharp price decline, followed by a slight upward consolidation. This pattern suggests that the price is expected to keep falling once it breaks below the lower boundary of the flag.
Wedges
Wedges can be either continuation or reversal patterns, depending on the trend direction and the slope of the wedge.
- Rising wedges typically form during an uptrend and suggest a potential reversal to the downside. The wedge is formed by the price movements converging upwards in a narrowing pattern.
- Falling wedges, on the other hand, form during a downtrend and indicate a potential reversal to the upside. The price movements converge downwards in a narrowing pattern.
However, when these wedges form in the direction opposite to the prevailing trend, they can also act as continuation patterns.
Triangles
Triangles are common continuation patterns that indicate a period of consolidation before the trend resumes.
- Symmetrical triangles are formed when the price converges with lower highs and higher lows, creating a symmetrical triangle. This pattern indicates that the market is undecided, and a breakout in the direction of the prevailing trend is likely.
- Ascending triangles are characterized by a flat upper trend line and an ascending lower trend line. This pattern suggests bullish sentiment and a potential breakout to the upside.
- Descending triangles have a flat lower trend line and a descending upper trend line, indicating bearish sentiment and a potential breakout to the downside.
Recognizing these continuation patterns and understanding their implications can significantly enhance your trading strategy. They offer clues about the market’s next move, allowing you to position yourself accordingly. Whether you’re looking at Bitcoin’s surge or analyzing stock trends, these patterns provide a roadmap for navigating the markets.
In the next section, we’ll explore reversal patterns, which signal a potential change in the market’s direction, adding another layer to your trading arsenal.
Reversal Patterns
While continuation patterns signal the persistence of an existing trend, reversal patterns hint at an impending change in the market’s direction. These patterns are crucial for traders looking to anticipate market turns and position themselves early for potential profit opportunities.
Head and Shoulders
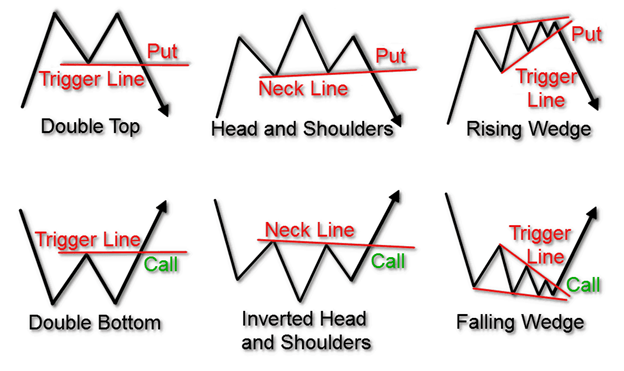
The Head and Shoulders pattern is one of the most reliable reversal indicators in technical analysis. It appears at the peak of an uptrend and signals that the trend is about to reverse to the downside. The pattern consists of three peaks: the left shoulder, the head, and the right shoulder, with the head being the highest peak. The line connecting the lowest points of the two troughs (neckline) becomes the key level to watch for a potential sell signal upon breakdown.
Conversely, the Inverted Head and Shoulders pattern emerges during a downtrend and signals a bullish reversal. This pattern features three troughs, with the central trough (head) being the deepest and the two others (shoulders) being shallower. A breakout above the neckline indicates a potential buy signal.
Double Top and Double Bottom
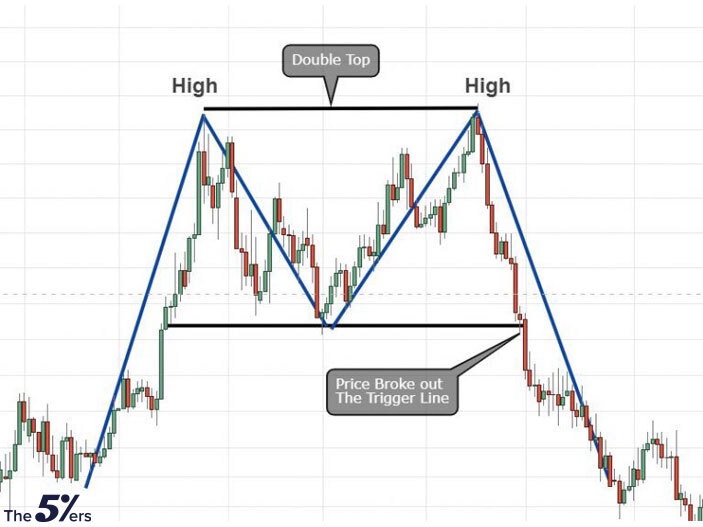
Double Top is a bearish reversal pattern that forms after a significant uptrend, indicating that the upward momentum is waning and a reversal to the downside is imminent. It is characterized by two consecutive peaks of similar height, followed by a break below the support level formed between the peaks.
Double Bottom, the bullish counterpart, occurs after a downtrend and suggests a reversal to the upside. It features two consecutive troughs of similar depth, with a breakout above the resistance level formed between the troughs serving as a buy signal.
Triple Top and Triple Bottom
The Triple Top pattern is a variation of the Double Top and is considered even more bearish. It consists of three peaks at approximately the same level, followed by a breakdown below support, signaling a strong reversal from an uptrend to a downtrend.
The Triple Bottom pattern is the bullish version, featuring three troughs. A breakout above the resistance level after the third trough indicates a strong reversal signal from a downtrend to an uptrend.
Symmetrical Triangle
While often considered a continuation pattern, the Symmetrical Triangle can also serve as a reversal indicator depending on the breakout direction. The pattern is formed by converging trendlines as the price moves in increasingly smaller oscillations. A breakout from the triangle can signal either a continuation of the current trend or a reversal, making it a versatile pattern for traders.
Understanding and correctly interpreting these reversal patterns can significantly enhance a trader’s ability to make informed decisions. By recognizing the early signs of a market turn, traders can adjust their strategies, whether it’s taking profits before a downturn or positioning for a new uptrend.
In the next section, we’ll delve into practical trading strategies that incorporate both continuation and reversal patterns, helping you to refine your approach to the markets. Whether you’re trading on the momentum of Bitcoin’s surge or navigating the shifts in traditional markets, these strategies will be invaluable.
Practical Trading Strategies
Having explored the world of chart patterns, both continuation and reversal, it’s time to translate this knowledge into actionable trading strategies. Understanding these patterns is one thing, but knowing how to apply them effectively in the market is what separates successful traders from the rest.
Identifying Entry and Exit Points
One of the most critical applications of chart patterns is identifying optimal entry and exit points. This involves recognizing the completion of a pattern and acting swiftly to capitalize on the impending price movement.
- Entry Points: For continuation patterns, an entry point is typically identified following a breakout from the pattern. For example, in the case of a bullish flag, a trader might enter a long position once the price breaks above the upper boundary of the flag. Similarly, for reversal patterns like the Head and Shoulders, an entry point for a short position is identified once the price breaks below the neckline.
- Exit Points (TP): Setting profit targets (TP) is essential for managing trades and locking in profits. Traders often use the height of the pattern to estimate the potential price move. For instance, the height of the flagpole in a flag pattern can be projected from the breakout point to set a profit target.
Combining Technical Analysis with Fundamental Analysis
While chart patterns provide valuable insights into market sentiment and potential price movements, they should not be used in isolation. Combining technical analysis with fundamental analysis offers a more holistic view of the market, enabling traders to make more informed decisions. For instance, a bullish chart pattern in the context of strong company earnings or positive economic indicators can reinforce the likelihood of a successful trade.
Risk Management
Effective risk management is paramount in trading. This involves setting stop-loss orders to limit potential losses if the market moves against your position. The placement of stop-loss orders can be informed by chart patterns. For example, in a bullish flag scenario, placing a stop-loss order just below the lower boundary of the flag can protect against the risk of a false breakout.
Continuous Learning and Adaptation
The market is dynamic, and successful trading requires continuous learning and adaptation. Engaging with a community of traders, staying updated on market news, and analyzing past trades are all part of a trader’s journey to mastery. Resources like Unlocking Your Social Security at 62: A Strategy for Million Dollar Return and How to Increase Revenue Without a Complete Overhaul offer insights into strategic thinking and financial planning that can complement technical trading skills.
By integrating chart patterns into your trading strategy, paying attention to market context, and practicing disciplined risk management, you can enhance your trading performance and navigate the markets with greater confidence. Remember, the key to successful trading lies not just in the patterns themselves but in how you apply them within a comprehensive trading plan.
Incorporating Chart Patterns into Your Trading Plan
A well-crafted trading plan is essential for navigating the markets effectively. It’s not just about recognizing chart patterns; it’s about integrating these patterns into a coherent strategy that aligns with your trading goals, risk tolerance, and market outlook. Here’s how to incorporate chart patterns into your trading plan for better decision-making and improved outcomes.
Setting Clear Trading Goals
Begin by defining what you aim to achieve with your trading. Are you looking for short-term gains, or are you in it for the long haul? Understanding your objectives will help you determine which chart patterns and trading strategies are most relevant to you. For instance, continuation patterns like bullish flags may be more suited to traders looking for quick, momentum-based trades, while reversal patterns like double bottoms might appeal to those aiming for longer-term position reversals.
Analyzing Market Context
Chart patterns don’t exist in a vacuum. Their significance can vary greatly depending on the broader market context. Before acting on a pattern, consider the current market conditions, including trends, volatility, and economic indicators. This holistic approach can help you assess the strength of a pattern’s signal. For example, a head and shoulders pattern forming at a major resistance level during a market-wide uptrend might signal a more significant reversal than the same pattern occurring in a less consequential market phase.
Risk Management Strategies
Incorporating chart patterns into your trading plan also means integrating them into your risk management strategy. Decide in advance how much of your capital you’re willing to risk on trades based on specific patterns. Use the patterns to set strategic stop-loss orders to minimize potential losses. For example, if trading on an ascending triangle pattern, you might place a stop-loss just below the triangle’s lower trend line to protect against a false breakout.
Continuous Education and Adaptation
The financial markets are constantly evolving, and so should your trading plan. Regularly review and update your plan to reflect changes in market conditions, your trading performance, and new insights gained from experiences. Resources like How to Build Wealth and Retire Early can inspire you to refine your financial strategies and adapt your trading plan to better meet your long-term financial goals.
Leveraging Educational Resources
Finally, make use of educational resources to deepen your understanding of chart patterns and refine your trading strategies. Whether it’s through books, courses, or articles like Bitcoin’s Surge: Breaking the $54,000 Barrier for the First Time Since 2021, staying informed about market trends and trading techniques is crucial for success.
Incorporating chart patterns into your trading plan is about more than just identifying potential entry and exit points. It’s about creating a comprehensive strategy that considers your financial goals, market context, risk management, and the need for ongoing education and adaptation. By doing so, you can use chart patterns not just as trading signals, but as tools for building a more robust and resilient trading approach.
Getting Through the Markets with Chart Patterns
Chart patterns are invaluable tools in a trader’s arsenal, offering insights into market sentiment, potential trend continuations, and reversals. By understanding and applying these patterns within a comprehensive trading plan, traders can enhance their ability to make informed decisions, manage risk effectively, and pursue their financial goals with greater confidence.
From the bullish enthusiasm of ascending triangles to the cautionary tales told by head and shoulders patterns, each chart formation brings its own story and strategy implications. However, the true art of trading lies not just in pattern recognition but in integrating these insights into a broader trading strategy that accounts for market context, risk management, and personal financial objectives.
As we’ve explored, successful trading is a blend of technical skill, strategic planning, and continuous learning. By staying informed, adapting to market changes, and maintaining a disciplined approach to risk management, traders can navigate the markets more effectively and work toward achieving their trading aspirations.
Questions and Answers on Chart Patterns and Trading Strategies
How reliable are chart patterns in predicting market movements?
Chart patterns are tools derived from historical price action, and while they can provide valuable insights into potential market movements, they’re not foolproof. Their reliability can vary based on market conditions, the asset being traded, and the overall market sentiment. Combining chart patterns with other forms of analysis, such as fundamental analysis and technical indicators, can enhance their predictive power.
Can beginners easily learn to trade using chart patterns?
Yes, beginners can learn to trade using chart patterns, but it requires time, education, and practice. Starting with the basics and gradually exploring more complex patterns is a good approach. Utilizing educational resources, such as trading courses and articles, can also be incredibly helpful.
How important is risk management when trading with chart patterns?
Risk management is crucial when trading with chart patterns or any trading strategy. Even the most well-identified patterns can fail, and market conditions can change unexpectedly. Setting stop-loss orders, managing position sizes, and having a clear exit strategy are essential components of effective risk management.
Are chart patterns applicable to all types of markets?
Chart patterns can be applied across various markets, including stocks, forex, cryptocurrencies, and commodities. However, the specifics of how these patterns play out can differ based on the market’s liquidity, volatility, and the asset being traded. Traders should adapt their strategies to fit the characteristics of the market they’re operating in.
By embracing the challenges and opportunities presented by chart patterns, traders can navigate the complexities of the financial markets with greater insight and strategy. Remember, the journey to trading mastery is ongoing, and each trading day offers new lessons and opportunities for growth.